Vital Statistics of Neutron Star Collisions
Statistics is central to gaining insights from gravitational wave events, as the contributions from University of Edinburgh statistician Jonathan Gair, and physicists Andy Lawrence and David Homan reveal.
The first direct detection of ripples in the fabric of spacetime from a black hole merger (GW150914) in 2015 was a triumph for science. It opened up a whole new window to the cosmos, tearing down the curtain that many had thought would always shroud black holes from ever being probed. Yet the news was not transformational for observational astronomers. Black holes were still black and therefore still invisible to telescopes.
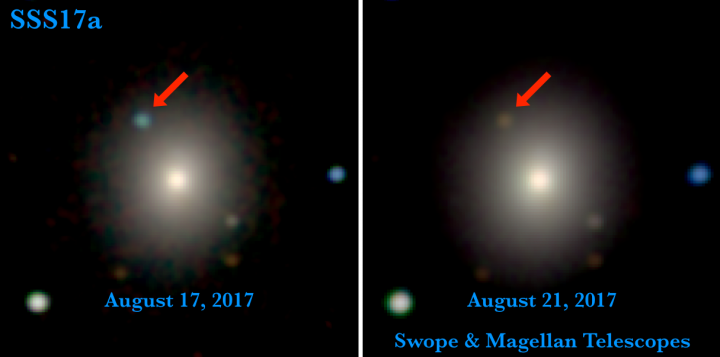
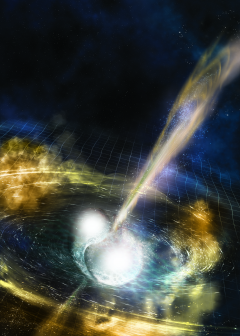
This all changed in August 2017 though, when scientists working at the LIGO and Virgo gravitational wave facilities detected a neutron star merger for the very first time, named GW170817. Unlike a black hole merger, where light can never escape the colossal gravitational pull of the two objects, neutron stars emit radiation, meaning astronomers can see their collision in all wavelengths of the electromagnetic spectrum.

Race to find a kilonova
Straight after the gravitational waves were detected, alerts were sent out to observatories around the world in the hope that somebody could see a sign of the event other than the gravitational waves rippling past the Earth. By happy coincidence, two postgraduate researchers – the University of Edinburgh’s David Homan and Joe Lyman from the University of Warwick – had just recently arrived at the NTT telescope in Chile when the alert came through.
David and Joe, assisted by the NTT team, quickly began trawling through potential galaxies the event could have come from to look for any new, bright spots. But then another message came through to check a specific object in an old elliptical galaxy that looked promising. Unfortunately, the position of the object presented a problem for the UK pair: “It was quite close to the horizon by the time the Sun was down,” David recalls “So we only had a few hours at the very start of the night to quickly try to observe it.”
Despite this, they managed to take a spectrum of the object only a day after the first alert. They were only the second team on the planet to do so. But more importantly, even though the object was sinking quicker and quicker below the horizon and dimming at the same time, David and Joe’s follow-up observations over the next few nights confirmed what the LIGO and Virgo teams had suspected: it was indeed a neutron star merger. “We were able to identify it as a kilonova, something that matched theoretical predictions for the type of emission you would see when two neutron stars merged,” David says.
In the days and weeks that followed, David and his postgraduate supervisor Andy Lawrence, alongside other members of the Public ESO Spectroscopic Survey for Transient Objects (PESSTO) consortium, published several papers on the neutron star merger spectra, showing how they evolved over time. Andy explains they used “pretty standard, but crucial” statistics in ensuring that the observed kilonova and gravitational wave signal were the same event, and in comparing the observed spectra with models of how heavy elements form in a neutron star merger. “There’s always statistics when we’re doing astronomy, all the time,” he adds.
Statistics of gravitational waves
But for another Edinburgh researcher working in gravitational wave astronomy – whose path fleetingly crossed David and Andy’s during GW170817 – statistics is more than crucial, it’s central. Jonathan Gair has been involved in gravitational wave science since 2002. “When I finished my PhD, this new field of gravitational waves was just starting – it was very exciting,” he says. “It was about 90 years after Einstein had predicted the existence of gravitational waves and it seemed likely we would soon have the technological capabilities to start to observe them.”
Though the decade-long wait was longer than anticipated, it gave him plenty of time to prepare for the first directly observed gravitational wave in 2015. Published just before GW150914 or ‘The Event’, as it’s sometimes referred to in LIGO circles, detected by the twin LIGO detectors in Hanford, Washington state, and Livingston, Louisiana, USA, Jonathan and collaborators had developed a Bayesian rate estimation method capable of determining the rates of gravitational-wave events in the presence of potential confusion with events arising from terrestrial or instrumental noise. With a little tweaking, the technique was then employed for the analysis of GW150914.
“My main role in the analysis of the first detection was to help work out the implications for the rate of similar events that are happening in the Universe,” explains Jonathan. To do this, he and his colleagues needed to pin down the noise properties of the LIGO instruments, since the data is a mixture of noise artefacts and astrophysical signals. “In principle if you have no way to distinguish between the two, it’s very hard to separate them,” he says. “But we knew that sources in the Universe are probably distributed uniformly in volume.”
This allowed the team to discern between noise, whose distribution decays exponentially and can be estimated by comparing the data in the two different LIGO instruments, and astrophysical signals, which follow a power law distribution. “We found that you’d have to wait 200,000 years to expect to have one event that loud from instrumental artefacts,” he says. Knowing this meant they could factor noise into the Bayesian rate calculation.
Then, to avoid an over-optimistic rate, Jonathan and his collaborators had to carefully remove potential bias from the fact that the black hole merger was detected soon after the detectors started collecting data. The results revealed that mergers of binaries of two black holes would occur between once every 10,000 years and once every million years in each galaxy, and LIGO would be expected to detect about 5 such events per year. Since those first observations the detectors have increased in sensitivity so that the expected rate is now approximately one per week.

Standard siren
Skipping forward to 2017, Jonathan was again heavily involved in wielding his statistical expertise in understanding the implications for cosmology of the GW170817 neutron star merger. His main contribution to the analysis was in estimating the Hubble constant. The Hubble constant measures the mean local expansion rate of the Universe and in the nearby Universe it is approximately the redshift of a source divided by the distance to the source.
Using telescope observations, such as those by David, allowed Jonathan and several LIGO/Virgo collaborators to measure the redshift of the neutron star merger, i.e. how fast the galaxy in which the event happened is moving away from us. And as the gravitational wave data provide the distance to the event, the team conducted combined statistical analyses to bring together the electromagnetic and gravitational wave information in order to obtain a Hubble constant of 70.0 km s-1 Mpc-1, providing completely independent confirmation of existing measurements.
As with most measurements in astronomy though, this number comes with uncertainty, and it was the Bayesian hierarchical model developed by Jonathan and colleagues to account for measurement uncertainty and selection bias that determined it to be roughly 15%. Despite it currently being less precise than other measures, the advantage with measuring the Hubble constant this way is that the accuracy will just get better with time. “As there are more events, every one will give a comparably precise estimate of the Hubble constant, and if you combine them your precision improves like the square root of the number of events,” explains Jonathan.
Why this matters is that current estimates for the Hubble constant have been obtained in two different ways – either looking at supernovae or looking at the cosmic microwave background – and they don’t exactly agree. Further neutron star data could resolve this discrepancy once and for all. “We may even end up getting a value that disagrees with both of them, which would also be interesting depending on how it resolves the problem.”
Benjamin Skuse is a freelance science writer based in Somerset, UK. https://benjaminskuse.wordpress.com

