Exposing Liver Cancer
When hepatologist Tom Bird realised current methods of liver cancer detection were leading to misdiagnosis, he called in statisticians from the Centre for Statistics to help him remedy the situation

Cancer is a topic in which statistics play a central role – from the well-known and thought provoking ‘1 in 2 people will get cancer’ estimate from Cancer Research UK, to a huge range of statistics on risk factors and incidence rates in different populations that inform medical decision making. Yet rarely does cancer statistics tax statisticians.
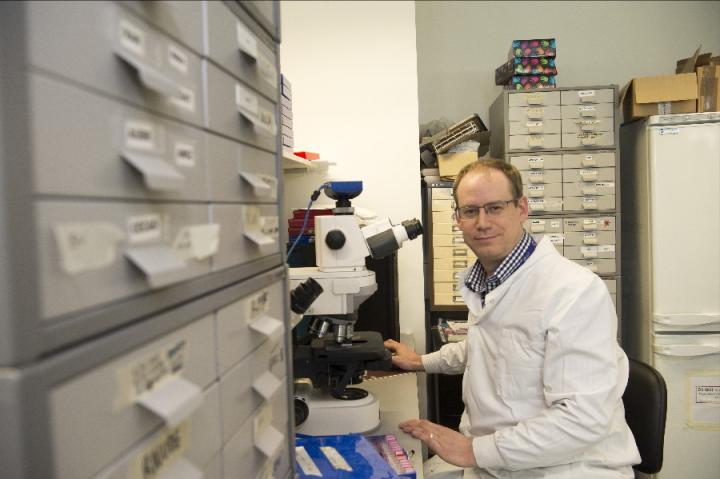
Tom Bird is a liver doctor based in the Royal Infirmary of Edinburgh who also leads the Liver Disease and Regeneration research group at the Cancer Research UK Beatson Institute in Glasgow. Several years ago, Tom and his clinical colleagues came to the realisation that the methods used to detect early forms of liver cancer – when the disease is at its most treatable – were not working.
A meeting of minds

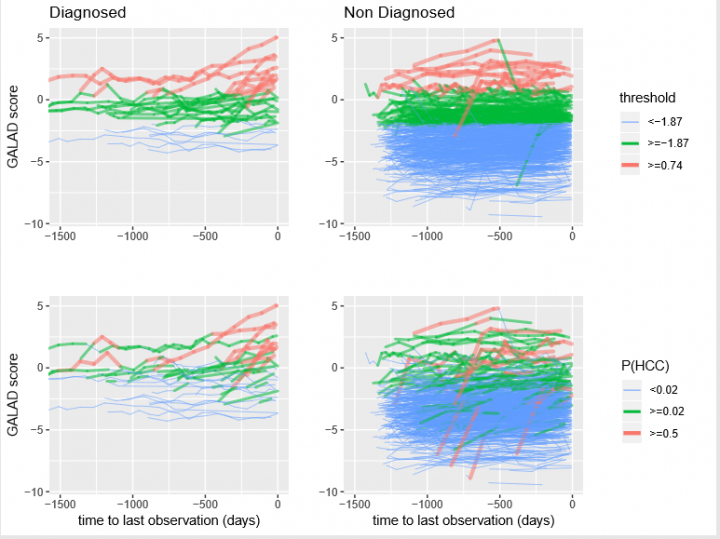
The standard screening procedure for liver cancer is to use a simple threshold level of a blood biomarker to decide whether a patient is at risk or not. “What became clear on the wards and in the clinics was that it wasn’t the level for an individual that was important for detecting the early form of the disease.” he recalls. “It was how that level changes over time.” This was and is a cause for concern, as these standard diagnostic methods see some patients undergo expensive and stressful investigations for a potential cancer that they don’t have, while other patients are being given the all clear when they are in fact experiencing the early stages of the disease.
By chance, at around the same time Tom was starting to explore this problem, Ruth King – Thomas Bayes' Chair of Statistics at the University of Edinburgh – happened to be working with one of Tom’s collaborators, the lauded statistician Sheila Bird OBE, on a completely unrelated topic. Sheila arranged a meeting between Ruth and Tom in December 2016 and the rest, as they say, is history.
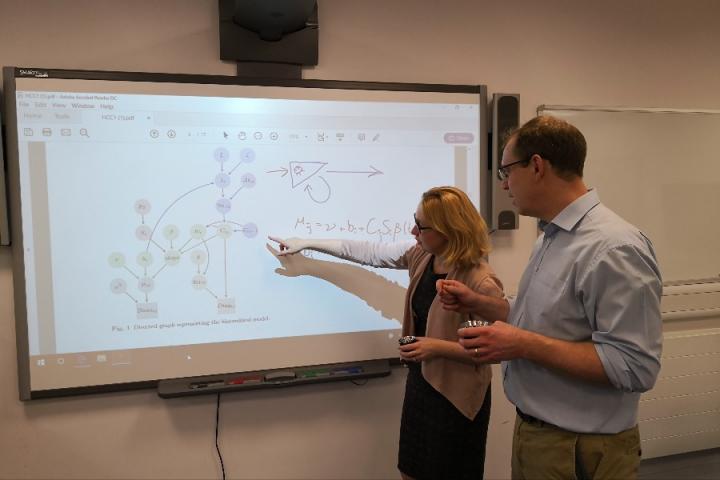
Ruth and Tom now have a small team working with them – consisting of Statistics Lecturer Vanda Inácio De Carvalho, research associate Ruben Amorós Salvador and PhD student Steven Soutar – on the project ‘Validating and improving serum biomarkers for liver cancer surveillance’. Aiming to improve test accuracy by detecting the moment of liver cancer development, the team is applying state-of-the-art statistical techniques in order to accurately decipher important changes over time in blood biomarkers.
Hidden Markov model
Ruth admits that before her collaboration with Tom she had “done nothing in the clinical medical literature”. But early on she saw potential to apply hidden Markov models – previously used by her to answer questions in ecology – to liver cancer.
A hidden Markov model splits the underlying system into two parts: a system process, which is the ‘truth’; and an observation process, which is what we see given that ‘truth’. The observation process sits on top of the underlying system process and describes what we observe of the ‘true’ system. This is done because the underlying system process is hidden – in some sense it can be thought of as missing data.
In the liver cancer project, the hidden truth (the system process) the researchers want to expose is whether and when a patient has gone from being cancer-free to having a tumour. And the observation process is dictated by how the patient’s biomarker score changes over time, which also depends on whether or not they have a tumour.
This may sound simple. But both the system and observation process, and how they link together, are steeped in complexities specific to liver cancer, as Ruth confirms: “To fully address the question we have had to do something novel statistically, because off-the-shelf doesn’t quite work.”
For instance, the fact that no two individuals are the same in terms of the relationship between their biomarker levels and disease status, and further confounding effects like the vagaries of how the health system operates and the irregularity of different patient screening test visits, have made finding the hidden truth a challenge.

Progress through collaboration
This challenge would have been insurmountable had it not been for Tom’s expert opinion. “We’ve come up with some crazy ideas trying to understand the models when we’ve looked at results,” says Ruth. “If we didn’t have Tom’s medical input, we could have added in components that didn’t make medical sense and would not have properly tackled the clinical questions that needed answering.” Similarly, Tom says “there is absolutely no way I could work on and begin to solve these sort of complex problems alone.”
Given so many variables and unknowns, the team needed a rich dataset on which to develop their model and gain an understanding of any link between developing a tumour and the monitored biomarkers scores. They found it through a collaboration with international colleagues, sourcing data from Japan consisting of 2273 patients who had been screened for liver cancer using multiple biomarkers multiple times.

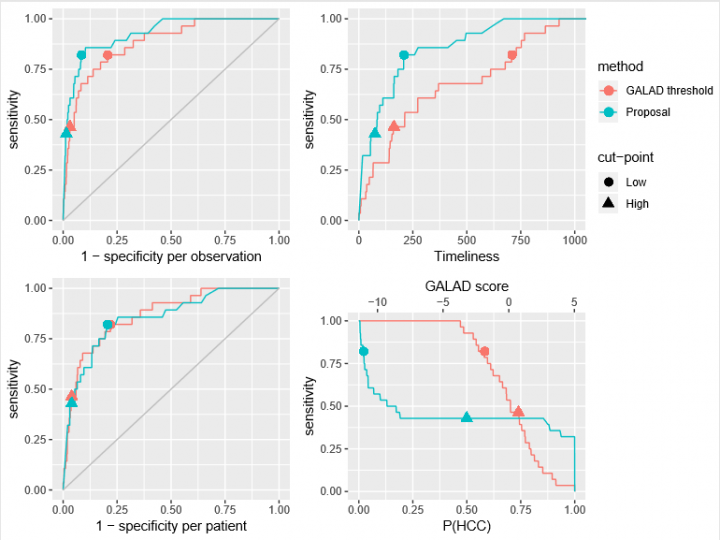
They then used the same data to pit their solution against a biomarker-based diagnostic test that is well-established in Japan. Known as GALAD, it combines gender, age and three separate biomarkers (AFP L3, AFP and DCP) into a single score. If a patient scores above a certain threshold, it suggests they have a tumour.
Initially, the GALAD score’s simple threshold appeared to yield better results than the team’s early models. But by tweaking the dependencies in the model, looking at the output, discussing the medical intricacies and incorporating how the GALAD score itself changes over time, the latest comparisons have been far more encouraging.
Real-world impact… and coffee
Having now built a formal statistical framework, the team is turning their attention to the future, and looking forward to the project having real-world impact on patients, as Tom explains: “Our hope is that we can validate this prospectively, introduce these newer tests to the UK and create an application for healthcare providers which may impact upon early detection of liver cancer”.
And their ambitions do not stop there, with the team keen to explore the predictive power of each biomarker in granular detail, and to branch out and apply the model to other diseases. “It is likely that we can make it more accurate and applicable to different populations, different disease types or even different combinations of blood tests,” Tom enthuses.
However, Tom might have a more personal motivation for extending the collaboration: “Ruth has a great supply of coffee which is pretty essential for me, as a parent of two young children, as a clinician, as a researcher, but more importantly it is one of the few things that is actually protective against liver cancer.”
Benjamin Skuse is a freelance science writer based in Somerset, UK. https://benjaminskuse.wordpress.com

